
ℹ️ There may be various reasons for this problem. Both on the Agent side and on the Client (web browser) side.
To find the problem, we suggest checking the following:
1️⃣ Check whether the error occurs with only one agent or with several.
2️⃣ Check the log files of the Agent.
📖 You can read about log files here: Log files
3️⃣ If possible, try using a different network/Internet connection (for example: using tethering, mobile connection).
4️⃣ Use a different web browser. For example: Safari (in case of mac devices), Microsoft Edge, Google Chrome, Mozilla Firefox, Brave, etc. Check if the problem occurs with another web browser as well.
5️⃣ If your web browser has extensions/plugins, please temporarily disable all of them. If the error does not occur without extensions/plugins, enable them one by one. After each enablement, check whether the Screen application continues to function properly. This will allow you to find out which extension/plugin caused the problem.
6️⃣ When you encounter the problem, check your browser console for errors:
- For Chromium–based web browsers (for example: Microsoft Edge, Google Chrome, Brave, etc.) and Mozilla Firefox, right–click and select Inspect from the menu that appears.
In the DevTools window that opens, select the Console tab.
Note: In most of the web browsers, you can also use the F12 function key to open DevTools.
Check for errors (if any).
- If you are using a Safari browser and the problem appears, from the Develop menu, select Show Web Inspector and then the Console tab in the window that appears.
In case you do not have a Develop menu in your Safari browser, proceed as follows:
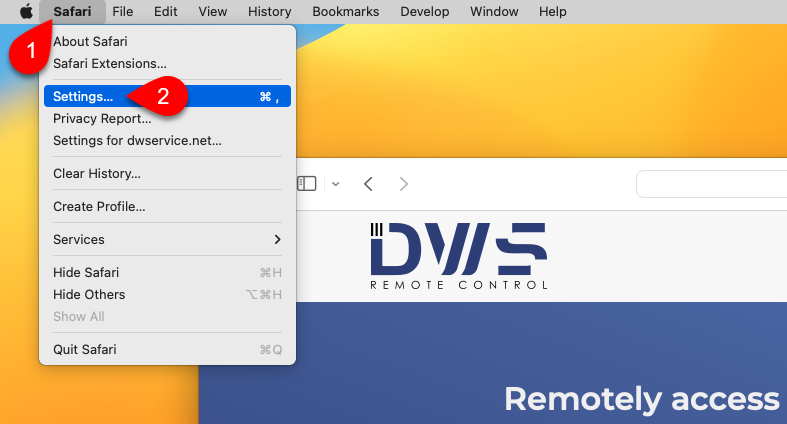
1. Select Safari.
2. Select Settings…
The following window will open:
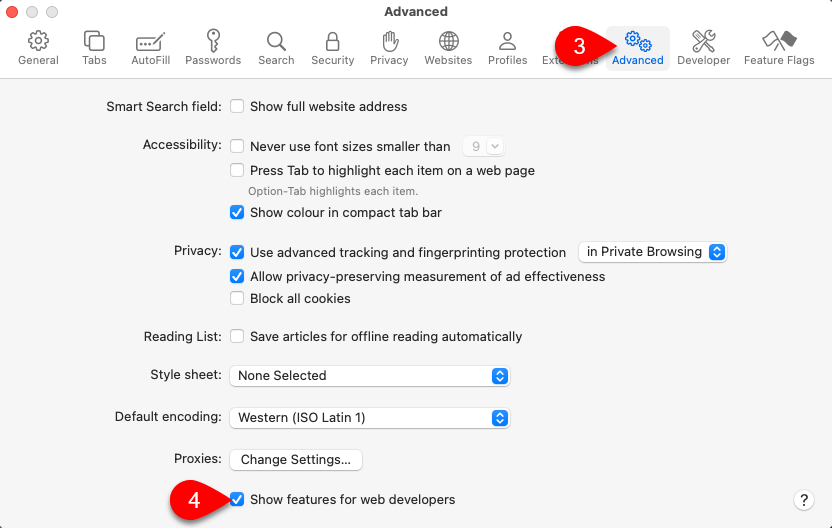
3. Select Advanced.
4. Tick the checkbox before the Show features for web developers.
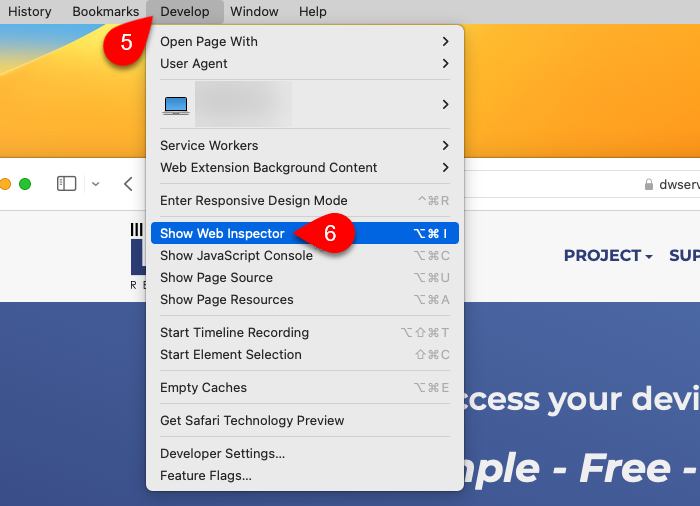
5. Select Develop.
6. Select Show Web Inspector.
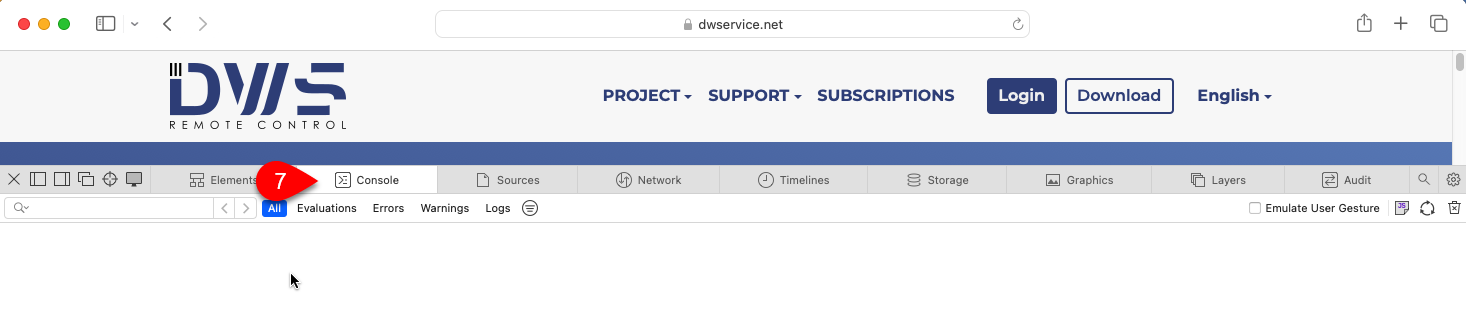
7. Select Console tab.
Check for errors (if any).
7️⃣ You can also search for errors in the operating system logs:
- Windows ⇒ Using the Windows Event Viewer.
- Linux ⇒ You can check for errors by running the dmesg command. Execute the dmesg command in a Terminal window:
- To display errors related to dwagent, enter this command:
sudo dmesg | grep dwagent - To display errors related to python, enter this command:
sudo dmesg | grep python
- To display errors related to dwagent, enter this command:
- macOS ⇒ Using the Consol application of the macOS system. (View log messages in Console on Mac – Apple Support)
8️⃣ If you have any Antivirus/Firewall protection, please temporarily disable them and check if the remote control is working properly.
📧 If your problem persists, please share with us the details (for example: the exact version of your operating systems, the version of your web browser, any error messages, dwagent.log file, etc.) at support@dwservice.net.